Downstream Cost Comparison
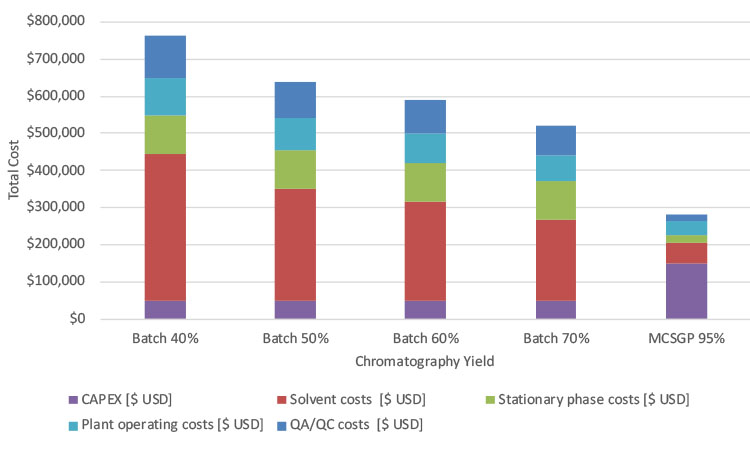
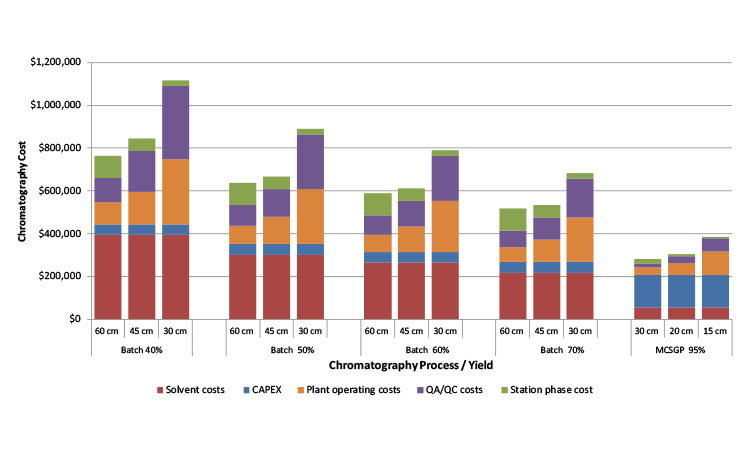
The downstream processing costs for batch chromatography, excluding the synthesis costs, are dominated by solvent costs and plant operating costs, followed by stationary phase costs and quality assurance/quality control (QA/QC) costs (Figure 6). Equipment costs (capital expenditure [CAPEX]/year with 10-year depreciation) are the smallest cost contributor. The overall downstream processing costs decrease with increasing yield, due to the lower number of additional batches that need to be synthesized to reach the annual production target of 10 kg peptide. As the yield increases from 40% to 70%, the annual downstream processing costs decrease from $760,000 to $520,000 USD for batch purification.
The downstream processing costs for the MCSGP scenario are $280,000 USD, representing at least 40% cost savings compared to the batch chromatography scenarios. The costs of MCSGP-based downstream processing are dominated by the CAPEX, which accounts for 50%. Smaller contributions are from plant operating costs, QA/QC, and solvent costs. For the MCSGP case, stationary phase costs are negligible, contributing around 3% to the downstream processing costs because significantly smaller columns are used (70.7 L (batch) vs. 2x 7.1 L [MCSGP]). Columns are typically repacked annually with 30% stationary phase replacement. Thus, the cost of goods sold (COGS) elements for the batch are different than for MCSGP and the absolute COGS for MCSGP are significantly lower.
Payback Period
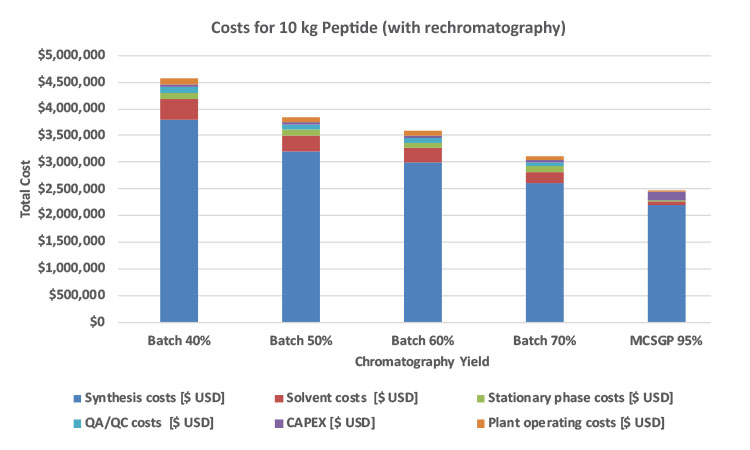
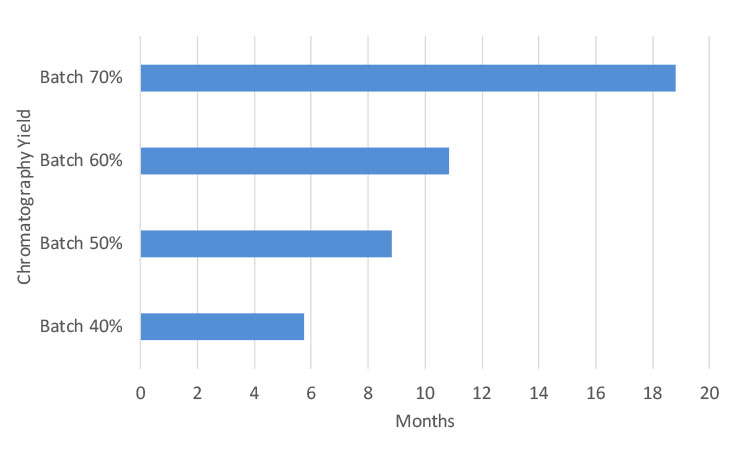
MCSGP total cost savings compared to batch chromatography scenarios are between $0.6 million to $2.1 million USD for 10 kg target production (Figure 5). The CAPEX cost difference of MCSGP HPLC systems vs. batch HPLC systems is estimated to be $1 million USD (Table A). Based on the preceding parameters, a payback period can be calculated as follows: Payback = (CAPEX difference batch vs. MCSGP)/(total cost savings by MCSGP). In comparison with batch processes with 40% or 70% yield, the payback period of MCSGP lies between 6 months and 19 months, respectively, as shown in Figure 6. The cost savings through MCSGP are dependent on the annual production amount and the batch yield. Higher target production quantities result in a corresponding shorter payback period, as equipment utilization is increased. See Figure 7 for payback period for investment in MCSGP compared to batch processes with different yields.
Operational Aspects of MCSGP
Besides the capital expense and payback consideration shown previously, MCSGP has benefits with respect to operational aspects, including the following.
- Reduced equipment requirements for pumps, pressure rating
- Reduced column dimensions
- Reduced stationary phase costs
- Reduced solvent consumption
- Overloading with MCSGP possible without performance loss for overlapping product/impurity peaks
- Reduction in QC sampling and testing
In the simulated cases, batch chromatography requires a 60 cm inner diameter column and 25 cm bed height, leading to a total column volume of 70.7 L, whereas MCSGP operates with two columns of 30 cm inner diameter and 10 cm bed height, resulting in a total bed volume of 14.2 L, leading to lower stationary phase costs. The use of smaller columns and resin volumes in MCSGP is possible due to the increased yield of the chromatographic process and to the larger linear flow rates of MCSGP, which strongly reduce the cycle time compared to batch chromatography. A summary of the operational results is provided in Table C. Another factor contributing to cycle time reduction is that during the disconnected states of the process, the columns are operated at half the residence time. Lower column hardware costs and facilitated packing of the smaller columns were not included in the calculations but would be also in favor of MCSGP.
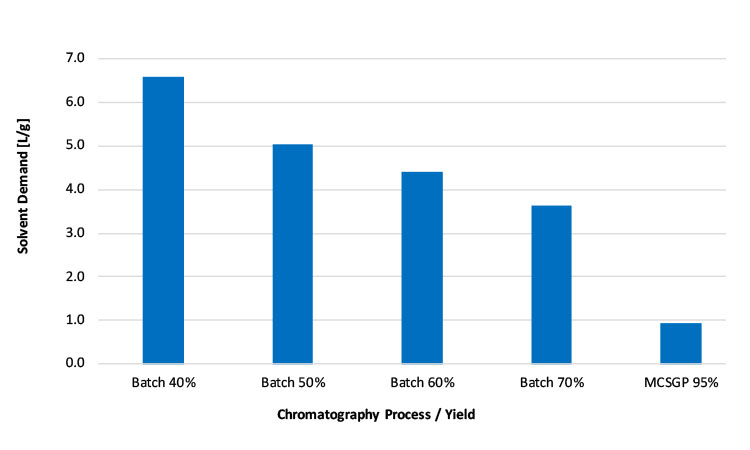
Smaller columns also reduce the required pump dimensions despite the larger linear ow rates that are used. Although an 8.5 L/min (= 510 L/h) pump is required on a batch skid, the MCSGP skid would only require 3.2 L/min (=190 L/h) pumps, resulting in smaller piping and components and a smaller equipment footprint despite using two columns. The higher load and yield of MCSGP leads to reduced solvent consumption in chromatography, measured in liters of solvent used per gram of peptide purified.
The solvent consumption decreases strongly with increasing yield: For MCSGP it is 0.9 L/g, whereas the consumption for a batch process with 40% yield is 6.6 L/g and the consumption for a batch process with 70% yield is 3.6 L/g (see Figure 8). Thus, MCSGP is capable of reducing solvent consumption by up to 85%, corresponding to up to a 56,000 L savings per year for 10 kg peptide produced. Although direct solvent cost savings have been quantified in the preceding cost calculation, indirect costs such as additional supporting infrastructure, solvent preparation, handling, and disposal have not be included. Because of the reduced solvent consumption of MCSGP, the latter factors would have numbers in favor of MCSGP.
MCSGP has a larger number of feed injections per run than batch chromatography but a lower number of QC samples than batch because for each cycle only a single pool is being sampled and analyzed. With batch chromatography, repetitive QC sampling and analysis is required because rechromatography results in more QC sampling. In this study, we assume that 10 analyses are required per single-column batch cycle and one analysis per MCSGP cycle. The smaller number of fractions in MCSGP leads to an overall reduction of QA/QC costs.
A sensitivity analysis was carried out to examine the impact of reduced column size on the downstream costs in dependence of the process/yield. For batch chromatography, the investigated column diameters were 60 cm, 45 cm, and 30 cm, whereas for MCSGP they were 30 cm, 20 cm, and 15 cm. The results are provided in Figure 9 and results show that for all cases (batch 40%–70% yield vs. MCSGP) stationary phase costs decrease as expected, but plant operating costs and QA/ QC cost rise and surpass the cost savings obtained using smaller columns. Smaller columns require larger operating times, as indicated in the figure, because more cycles (injections) need to be performed.
Conclusion
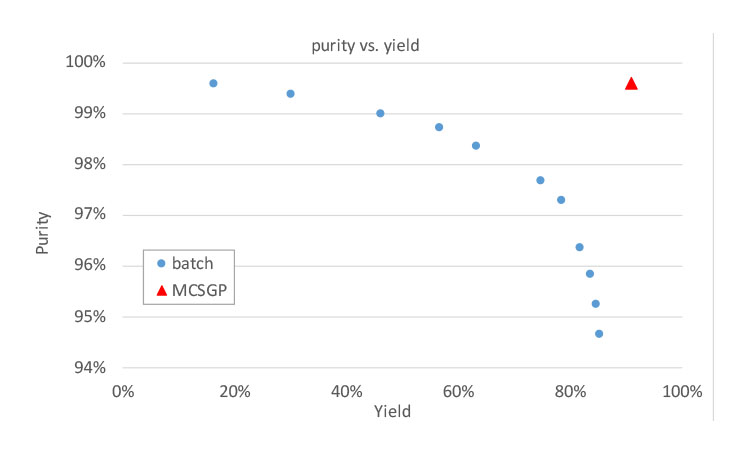
The economic evaluation of twin-column countercurrent chromatography (MCSGP) for the purification of peptides produced by chemical synthesis shows significant cost advantages of MCSGP, with a payback period for MCSGP compared to different batch scenarios of between 6 and 19 months for an annual production of 10 kg of peptide. Different cases of MCSGP with 95% yield and single-column batch processes with 40%–70% yield were compared, simulating purifications of varying difficulty due to variable impurity content or peptide size. Rechromatography was included in the calculations for single-column chromatography. MCSGP does not require rechromatography due to its high yield and has a total cost advantage (mainly by reducing the number of upstream synthesis batches required to reach target production quantity). Other advantages include significant reduction in solvent consumption.
The cost savings through MCSGP vary between $0.6 million and $2.1 million USD, depending on the yield of the single-column reference process. Thereby, the annual downstream processing costs range from $760,000 to $520,000 USD for single-column batch chromatography purification, depending on the yield, and only $208,000 USD for MCSGP, showing a cost savings of at least 40%. The analysis revealed that the use of larger columns was favorable due to the reduction in plant operating time and number of injections, leading to smaller QA/QC effort, which offset the larger stationary phase costs of larger columns. Indirect solvent costs such as additional supporting infrastructure, solvent preparation, handling, and disposal have not been included in the comparison but the numbers would be in favor of MCSGP due to its reduced solvent consumption.
Regulatory authorities are supportive of continuous manufacturing for pharmaceuticals, which also covers continuous chromatography techniques such as MCSGP. Available simulation and optimization tools allow a reduction in the number of designed experiments for defining the operating space and facilitate process validation.

