Quality Risk Management for Legacy Products in CMOs

This article was published in the March/April 2016 edition of Pharmaceutical Engineering® magazine. It is one of five articles nominated for the Roger F. Sherwood Article of the Year Award, all which will be posted to iSpeak throughout the week of 5 December.
Quality metrics, process performance, risk assessments and continued process verification
The pharmaceutical industry can be divided in two key groups:
- Innovators: companies that develop and may manufacture new drug substances or new drug products
- Generic manufacturers: companies that manufacture generic versions of drug substances or drug products that have/are going off patent
Contract manufacturing organizations (CMOs) operate under the same regulatory expectations as innovators and generic manufacturers, and provide manufacturing capabilities such as formulation, filling or packaging for both groups. They are considered an extension of the company contracting them for the manufacture of drug products. The discovery, development, and manufacture of drug products is a lengthy, complex and costly process.1 Generic companies use technical and clinical knowledge from the innovator to develop and market generic versions of drugs. This approach is less costly because there is no need to do expensive R&D with its inherent risks of clinical and toxicological work. By design, this allows the company to get product to market at a lower cost compared to innovator drug.2 The generic version of a drug will be manufactured based on the knowledge (e.g., intellectual property) and conditions (e.g., process parameters and quality attributes) engineered by the generic company, resulting in a product that is comparable to the brand product in term of strength, quality, efficacy, and performance for the intended use. Pharmaceutical companies must have robust quality systems in place to ensure drug products meet required quality standards and are manufactured to meet health authority requirements. This applies to innovators, generic manufacturers and CMOs that produce new and/or legacy products. Quality systems should satisfy the following elements:
Regulatory expectations: It is important to keep in mind that CMOs are seen by regulatory groups—including the US Food and Drug Administration (FDA), European Medicines Agency and Medicines and Healthcare Products Regulatory Agency—as an extension of the company that contracts with them. For this reason, quality agreements are developed to define expectations and responsibilities (equipment and utilities qualifications, deviations, change control, product testing, product specifications, etc.) to ensure that the CMO fulfills regulatory expectations. Meanwhile, the CMO’s quality program defines the strategy necessary to comply with regulatory expectations.
Process understanding and risk management: Multiple factors are linked to risk management. Among them are:
- Knowledge management: The transfer of process and analytical details is needed for the successful manufacture of the drug substance or drug product. This information is usually in the form of technical reports and comprehensive documentation such as process development reports, analytical method reports, manufacturing process description, control strategy, risk assessments, justification of process parameters, and quality attributes.
- Quality metrics: These are used to assess the CMO’s compliance level while manufacturing the drug substance or drug product. Parameters for routine evaluation are mutually agreed as part of the contract.
- Process performance: The level of control and effectiveness of the manufacturing process is monitored by means of statistical tools such as control charts and performance indicators, including process performance (Ppk) and process capability (Cpk). These help identify potential quality issues before an actual failure is experienced.
- Risk management (assessments, control, communication, review): A systematic evaluation of the manufacturing process, equipment, utilities, and materials provides the opportunity to identify potential areas for improvement as well as areas that must be monitored to prevent process or product quality failures.
- Continued process verification (CPV): Stage 3 under FDA’s guidance on process validation, this step requires routine monitoring of the manufacturing process to identify any trend affecting product quality attributes. Monitoring under CPV includes deviations, complaints, process changes, and the use of statistical tools such as control charts. CPV helps detect potential product quality issues based on historical evaluation of product related quality attributes and process parameters.
Discussion
Risk management of legacy products may represent a challenge, since some documentation associated with development and technology transfer may not fully satisfy today’s expectations. For example, initial validation documents for legacy products may not provide details about criticality of process parameters, quality attributes or control strategy, or may not consider all potential risks that may affect product quality. However, the experience developed during routine manufacturing throughout the years will provide the manufacturing facility with technical knowledge at full scale that is not feasible at laboratory- or pilot-scale levels. The CMO quality system and the sponsor granting the contract should be aligned on previously identified elements such as knowledge management, quality metrics, process performance, risk management and CPV. The following section provides aspects that may be considered guidance on legacy products, regulatory expectations, practices from the industry, role of the aspects and application of the elements at the CMO while mitigating and remediating existing documentation.
Knowledge Management
Regulatory Expectation
The knowledge gained during the development of a legacy product and its manufacturing process may not be captured in a comprehensive documentation package as discussed in ICH Q83 and ICH Q9.4 However, this should not prevent the manufacturer from compiling the necessary information and creating comprehensive documentation that demonstrates in-depth understanding of the product and manufacturing process.
Practices from Industry
Key players from the industry realize the criticality of knowledge management as process improvements and troubleshooting are facilitated by collection and evaluation of product and process data. Lipa et al.12 provide an example of the steps taken at Merck & Co. In general, approximately 20% of knowledge is captured in existing documentation (explicit knowledge), while about 80% is considered tacit and needs to be compiled and properly documented. Hubert 5 summarized the key progress on this topic in three steps:
- Demystify: Use a systematic approach to enable growth and flow, and create value based on knowledge management.
- Describe and debunk: Develop an organization in which knowledge is leveraged, optimize products and manufacturing processes, and identify and implement innovative approaches that will bring better financial performance
- Develop: Use knowledge to create teachable moments beyond routine training or searching for an expert.
Quality Metrics, Process Performance, Risk Assessments, and CPV
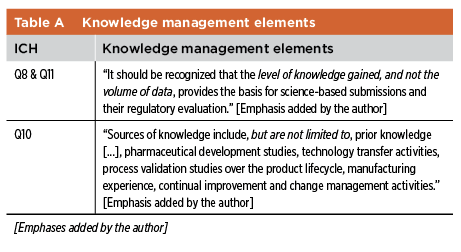
Neway 6 summarizes the relevance of knowledge management as the accumulation, accessibility and dissemination of institutional knowledge in every teachable moment. To achieve its full potential, data must be presented in the proper context to enable effective actions. Neway also highlights the elements from ICH Q8,3 Q107 and Q118 as they relate to the collection and use of data and knowledge management (see Table A).
Some information that can be available is:
- Quality metrics: complaints, investigations, product release
- Process performance: critical quality attributes, process parameters, in-process controls (IPCs)
- Risk assessments: root cause evaluations, failure mode and effects analysis (FMEA)
- CPV reports compiling process performance information
CMOs
Information exchange with the CMO is critical, as the manufacturing operation generates a significant amount of information. In the case of legacy products, both explicit and tacit knowledge need to be captured as part of the routine manufacture. If the original developmental work does not satisfy current expectations, a remediation exercise may be considered (e.g., generate the required documentation). An alternative is to consolidate all required information associated with the product and process in a single secure file. This serves as a supplement to the annual product review (APR) and existing process validation documentation package. It also includes quality metric data, critical quality attribute (CQA) capability analysis, critical process parameter (CPP)-CQA links, in-process testing and control strategy and risk assessments. These documents are maintained at the CMO and copies retained by the sponsor.
Quality metrics
Regulatory Expectations
While companies often apply metrics and regulatory agencies like to see such metrics applied; no specific requirements are currently in place. Multiple quality metrics are used across the industry to monitor the effectiveness of the manufacturing process and quality system. As described in ICH Q10,7 the goal is develop and use effective monitoring and control systems for process performance and product quality. Those metrics include, but are not limited to: complaints, deviations, rejected product, reworked/reprocessed product, recalls, process performance indexes and regulatory inspections.
Industry Practices
Standard industry metrics known as key performance indicators (KPIs) assess the need for improvements and facilitate troubleshooting of potential product quality and manufacturing process issues. KPIs used to monitor product quality and process performance include: number of manufactured lots, number of released lots, number of rejected lots, on-time delivery, release cycle time, deviation rate (deviations/lot), and overdue complaints.
Quality Metrics and Quality Agreement
As previously mentioned, quality metrics are intended to monitor process performance and product quality. The quality agreement with the CMO should either define those metrics or define the setup for metrics to be used in a routine basis.
CMOs
As previously discussed, metrics may be consolidated in a single file where key information associated with the product and process is compiled. This information serves as a supplement to the APR and existing process validation reports. These documents are maintained at the CMO, with copies retained by the sponsor.
Process Performance
Regulatory Expectations
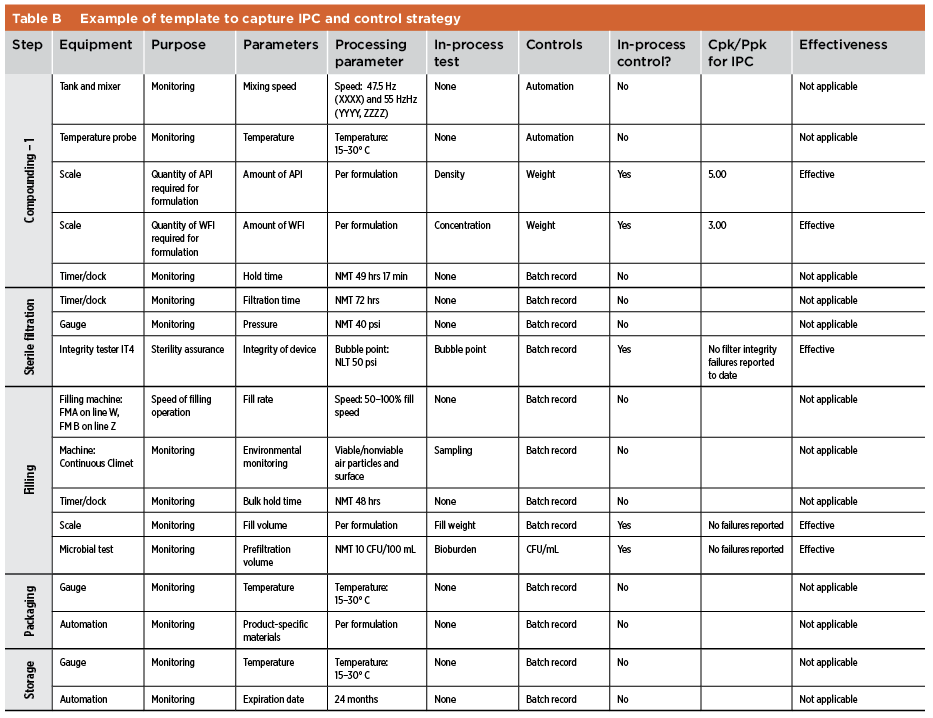
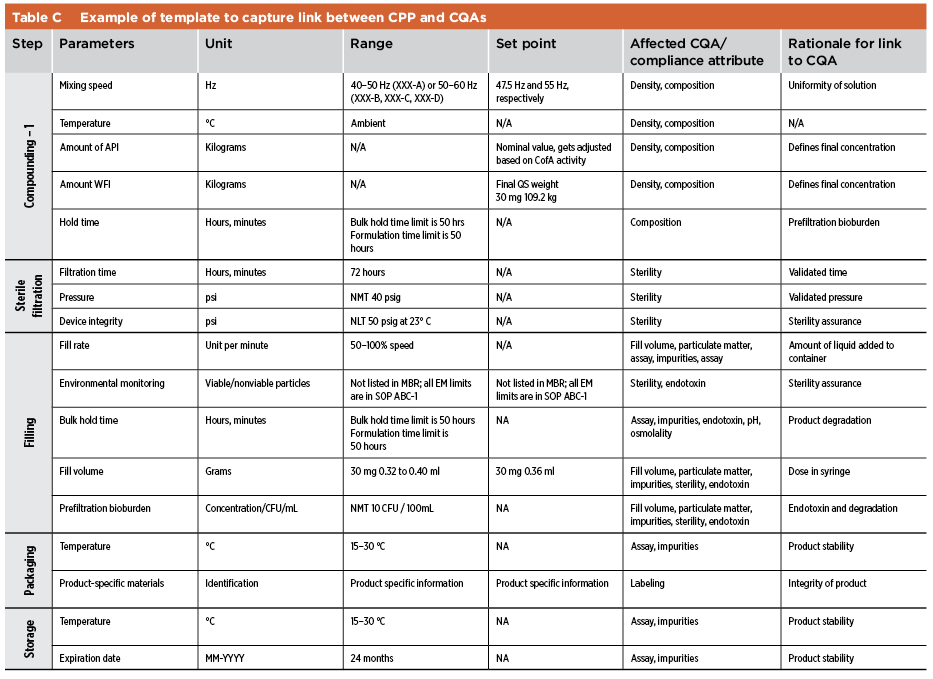
Quality risk management is used to identify gaps in process knowledge. Once such gaps are remediated via experiments or using previous knowledge, a control strategy for the manufacturing process is defined. As described in ICH Q10,7 the control strategy facilitates timely feedback and appropriate corrective and preventive actions (CAPAs) while monitoring the manufacturing process. Parameters and quality attributes identified in the control strategy include, but are not limited to, those related to drug substance, drug product materials and components, facility and equipment operating conditions, IPCs, finished product specifications and associated methods. In the case of legacy products, a quality risk tool such as FMEA may be used to assess the existing control strategy. Proper tools must be defined (e.g., statistical process control) to confirm the effectiveness of the current control strategy. In the case of legacy products, the link between CPPs and CQAs may be not fully understood, and further work may be required. Evaluations by CPPs and CQAs may supplement existing process validation documentation. IPC templates and examples of the control strategy and link between CPPs and CQAs are shown in Table B and Table C.
Industry Practices
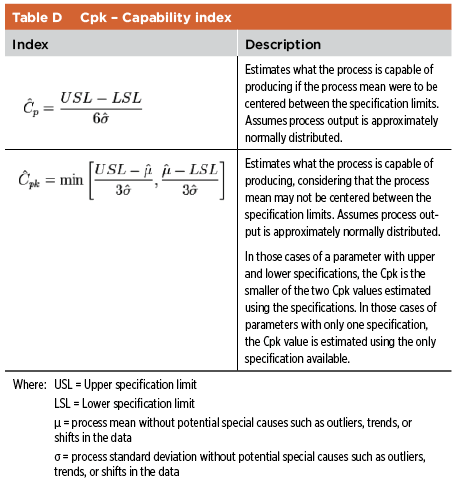
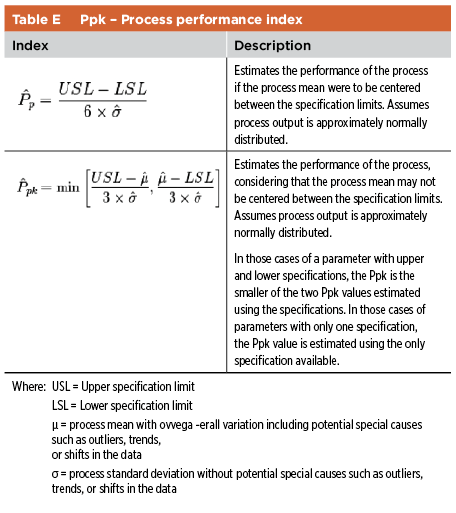
The industry has implemented different approaches to capture the information discussed above. The main consideration is a clear explanation and justification of the relationship between process parameters, quality attributes, and IPCs. Performance Indexes Performance indexes are used to assess the capability of the process, usually by considering various attributes such as assay, pH, fill volumes, particulate matter. Depending on the amount of data available, two potential indexes are Cpk and Ppk (see Table D and Table E).11
Information on Ppk or Cpk can be consolidated as part of the risk assessment and used as supplements to the legacy product validation documents. Table F shows a sample template summarizing the process performance evaluation of a drug product. 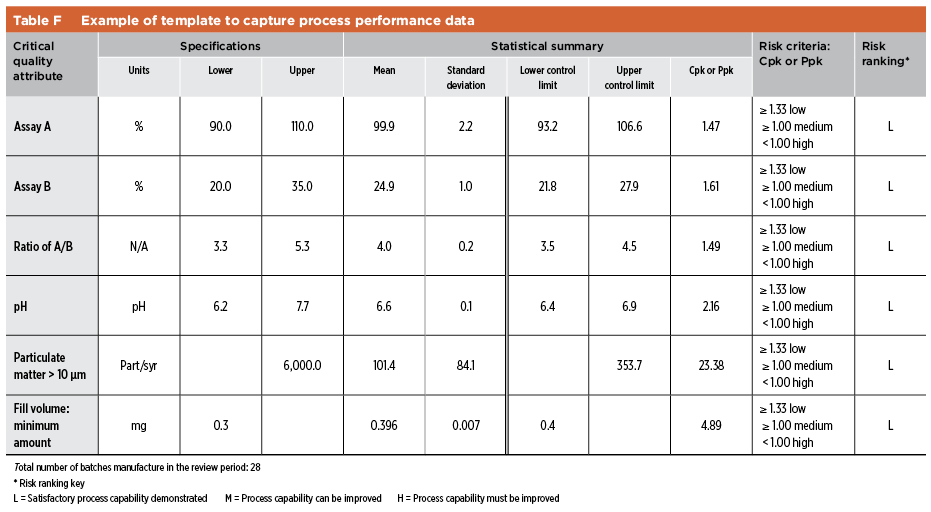
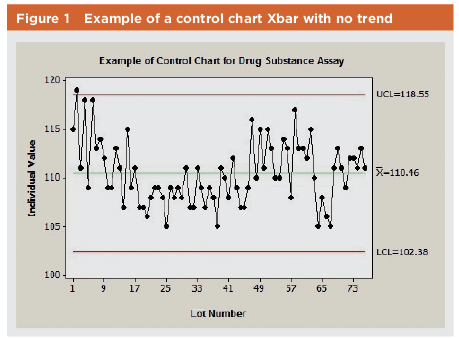
This type of evaluation leads to defining control limits, which are used to monitor the manufacturing process. This data is typically presented in the graphical form of a control chart. The sample control chart in Figure 1 shows one data point slightly above the upper control limit; that data point may or may not be investigated depending on how the organization defines the requirements for investigations. If the Ppk is greater than 1.33, for example, the organization may not proceed with a major investigation, given the overall capability, performance indexes, and the location of the data point with respect to the specification value (CL is 118.55 mg, upper specification is 150.0 mg, reported value is 119.0). When Ppk is between 1.0 and 1.33, however, the location of the data point related to the specification should be considered before ruling out the need for further investigation (CL is 118.55 mg, upper specification is 125.0 mg, reported value is 124.0).
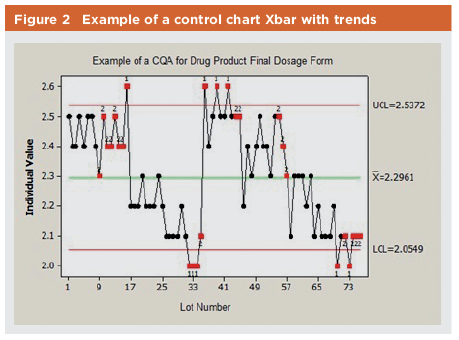
In general, if a process presents no values outside control limits, then the current process performance can be considered similar to historical process performance when the control limits were calculated. In cases where process performance shows an improvement (indicated by increased Ppk or Cpk), such change may be further evaluated to enhance process knowledge. The main goal of using control charts is to detect any potential drift or shift in process performance. Figure 2 shows an example of a process in which trends triggered further investigation to identify the root cause. In this example, no data is outside the specifications for the process (1.8% to 3.0%). There are two instances, however, when reported test results start running from 2.5 down to 2.1 (toward lower specification of 1.8). This affects the process capability. In this case, an investigation is initiated to identify the root cause via process or analytical testing.
CMOs
Historical data at the CMO is used to estimate process performance and capability indexes. Control limits are calculated and implemented for use as part of routine release testing. A release data review is conducted as part of both the CPV and APR programs. The CMO provides the information to the sponsor contracting them for the manufacture of the legacy drug products.
Risk management
Regulatory Expectation
Regulatory groups expect quality risk assessments to be part of the development and implementation of manufacturing processes. The goal of any risk assessment is to identify potential weak and critical points (steps with identified hazard) in a process to either correct and improve such step(s) or implement monitoring controls that prevent the quality of the product from being jeopardized.4 , 8 ,9 ,10
Industry Practices
The industry has implemented different approaches to capture the information required for risk assessments. The main consideration is a clear understanding of the manufacturing process, including process parameters, IPCs, and quality attributes. The risk assessment format depends on the scope and goal of the assessment, such as: quantitative using risk priority number or qualitative using a hedonic scale ranging from low to high. Table G presents a risk assessment that uses a quantitative scale. 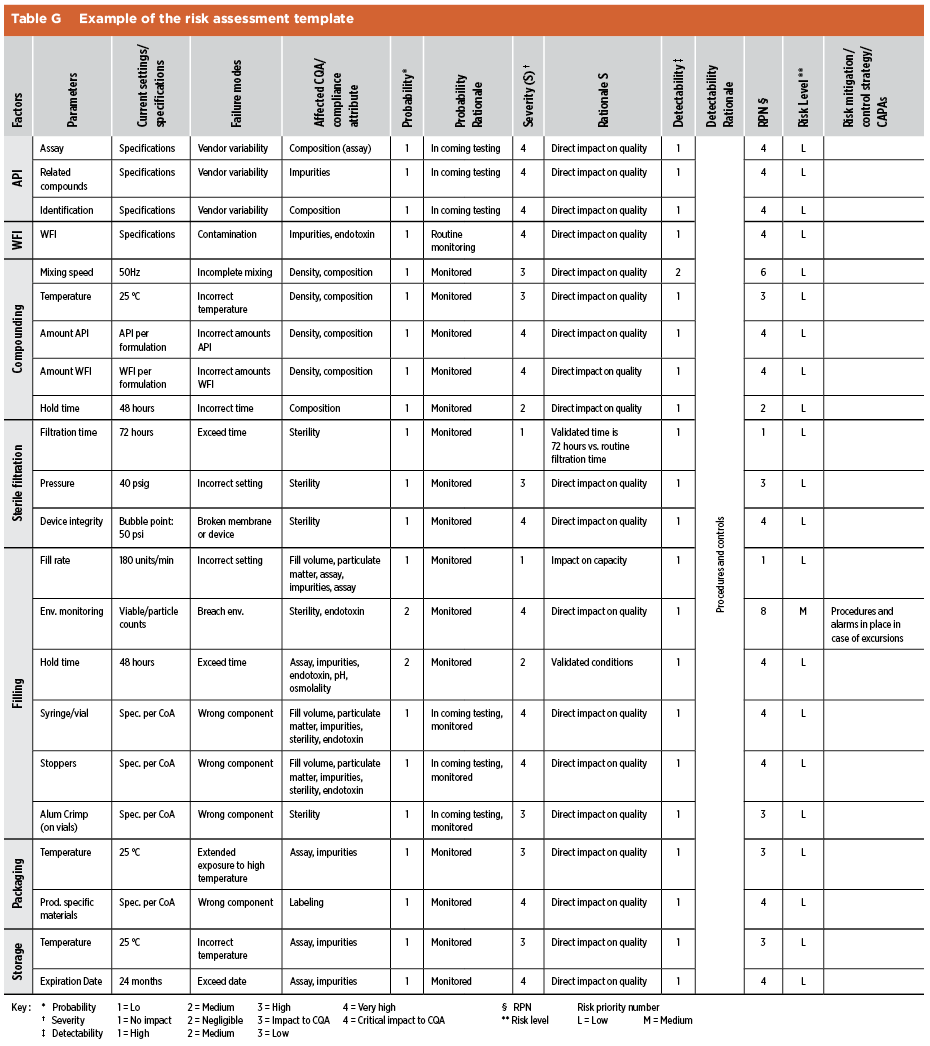
Risk Management
Risk management involves assessment, control, communication, and review of the risks identified in the manufacturing process. As mentioned previously, it helps identify weak or critical points within the manufacturing process that require either remediation or close monitoring to ensure no impact to product quality. Once a risk assessment is completed, the impact of remediation or mitigation activities is monitored following the recommendations identified as part of the assessment. In those cases where the manufacturing process is modified as part of continuous improvement initiatives, the risk assessment should be re-executed as part of the planning phase to assess future effects of the proposed change on the manufacturing process.
CMOs
Risk management involves both the CMO and the sponsor. Process improvements may be initiated by either group and are implemented by the CMO to ensure proper management of the risks (mitigation or elimination). Risk assessments may consider different tools, such as FMEA.
CPV
Regulatory Expectation
CPV is the final stage under FDA’s 2011 guidance following ICH Q10.13 The goal of CPV is to monitor the manufacturing process on a routine basis using statistical tools for deviations, changes, and/or complaints to detect and react to potential drifts or shifts on process performance before those changes may affect product quality.
Industry Practices
Routine monitoring of quality metrics, CQAs and CPPs is conducted to assess any potential change (drift or shift) on process performance. Validated Excel spreadsheets and other tools have been developed or are available in the market to help CMOs compile and analyze process data. In addition, periodic evaluation of process data under CPV is consolidated and reported as part of the APR at the end of the review period. CPV data is used to demonstrate the validated state of the process.
CPV
CPV highlights potential quality issues and associated CAPAs identified during periodic evaluations. CPV data is used to demonstrate the validated state of the process.
CMOs
The CMO implements CPV according to internal policies and procedures. The CMO provides the sponsor with summary reports as part of routine communication involving the manufacture of the drug products.
Conclusion
This article provides an overview of the key elements surrounding quality risk management while working with a CMO to support the manufacture of legacy products. Risk management of legacy products may represent a challenge because some documentation associated with development and technology transfer may not fully satisfy current expectations. The experience developed during routine manufacturing throughout the years provides the manufacturing facility with full-scale technical knowledge that is not feasible at laboratory- or pilot-scale levels. Multiple elements and examples in this document provide information on how to capture data associated with those elements to supplement existing validation documents for legacy products at the CMO: knowledge management, quality metrics, process performance, risk management assessments, and CPV. Once the risk assessment is completed, remediation activities may be defined to further improve product quality by means of continuous improvement of the manufacturing process.
- 1Harper, Matthew. “The Truly Staggering Cost of Inventing New Drugs.” Forbes, 10 February 2012). www.forbes.com/sites/matthewherper/2012/02/10/the-truly-staggering-cost-of-inventing-new-drugs.
- 2Levick, Richard. “Generic Drug Makers Will Soon Face the Regulatory Music.” Forbes 15 July 2013) www.forbes.com/sites/richardlevick/2013/07/15/generic-drug-makers-will-soon-face-the-regulatory-music.
- 3International Conference on Harmonisation of Technical Requirements for Registration of Pharmaceuticals for Human Use. ICH Harmonised Tripartite Guideline. “Pharmaceutical Development Q8(R2).” August 2009. www.ich.org/products/guidelines/quality/quality-single/article/pharmaceutical-development.html.
- 4 a b ———. ICH Harmonised Tripartite Guideline. “Quality Risk Management: Q9.” 9 November 2005. www.ich.org/fileadmin/Public_Web_Site/ICH_Products/Guidelines/Quality/Q9/Step4/Q9_Guideline.pdf.
- 12. Lipa, M., S. Bruno, M. Thien, and R. Guenard. “Practical Approach to Managing Knowledge - A Case Study of the Evolution of Knowledge Management (KM) at Merck.” Pharmaceutical Engineering 33, no. 6 (November–December 2013).
- 5Hubert, Cindy. 2014. “Knowledge for the Future.” Presented at the 2014 PDA Knowledge Management Workshop, 19-20May 2014, Bethesda, Maryland.
- 6Neway, J. 2014. “The Data Management Foundation of Effective Knowledge Management in Pharmaceutical Process Development, Manufacturing, and Quality.” Presented at the 2014 PDA Knowledge Management Workshop, 19-20May 2014, Bethesda, Maryland.
- 7International Conference on Harmonisation of Technical Requirements for Registration of Pharmaceuticals for Human Use. ICH Harmonised Tripartite Guideline. “Pharmaceutical Quality System: Q10.” 4 June 2008. www.ich.org/fileadmin/Public_Web_Site/ICH_Products/Guidelines/Quality/Q10/Step4/Q10_Guideline.pdf.
- 11 ———. Technical Report No. 44. “Quality Risk Management for Aseptic Processes.” 2008.
- 8———. ICH Harmonised Tripartite Guideline. “Development and Manufacture of Drug Substances (Chemical Entities and Biotechnological/Biological Entities): Q11.” 1 May 2012. www.ich.org/fileadmin/Public_Web_Site/ICH_Products/Guidelines/Quality/Q11/Q11_Step_4.pdf.
- 9 Parenteral Drug Association. Technical Report No. 54-2. “Implementation of Quality Risk Management for Pharmaceutical and Biotechnology Manufacturing Operations.” Annex 1: “Case Study Examples for Quality Risk Management in Packaging and Labeling.” 2013.
- 10 ———. Technical Report No. 44. “Quality Risk Management for Aseptic Processes.” 2008.
- 13US Food and Drug Administration. “Guidance for Industry. Process Validation: General Principles and Practices.” January 2011. www.variation.com/files/fda/FDA%20Process%20Validation,%20General%20Principles%20and%20Practices%202011.pdf.