Airflow Reduction in Cleanrooms after Closing Hours

Cleanrooms and laboratories can save a significant amount of energy by reducing airflow of air handling units (AHUs) after closing hours. Although challenging, airflow reduction is a successful energy reduction measure and has been implemented within the energy reduction program of Janssen Vaccines & Prevention B.V. in Leiden, the Netherlands.
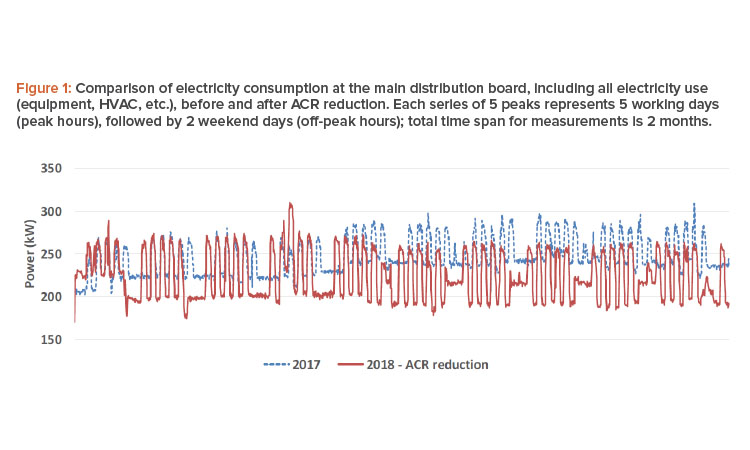
In laboratories with clean-air requirements (i.e., cleanrooms), air must be filtered to reduce the number of particles. Airflow, which is measured in air change rates (ACRs), is typically 10 times higher in cleanrooms than in offices. Humans and human activities are the main sources of particles, and our program has found that the cleanroom air change rates can be safely reduced after closing hour, when fewer staff members are present. This innovation not only reduces electricity consumption but also saves on district heating, cooling energy, and steam for humidification. In this case study, the HVAC system has variable air volume (VAV)–controlled air valves (active pressure control), and typical air change rates are in the range of 10 to 30. Figure 1 shows the program’s after-hours electricity savings due to air change rate reduction.
Within GMP-classified cleanrooms, 1 areas are pressure- controlled and the amount of supply flow is determined by the specified air change rates. The air change rate is defined in accordance with the specified cleanroom class; in this case, the cleanrooms are in classes C and D (≈ISO class 7 and 8, respectively). Most cleanrooms are kept at an overpressure (e.g., +15 Pa) to prevent outside particles from entering them. Some clean areas are kept at underpressure (e.g., –15 Pa) due to biological safety requirements and/or cleanroom requirements. Reducing airflow for these types of pressurized cleanroom systems while in operation was previously regarded as impossible due to pressure, particle (GMP, ISO 14644),2 temperature, recovery time, and biosafety requirements. However, the energy reduction program has met all criteria, and the system is currently operating satisfactorily. Within the energy reduction program, several energy-saving measures have been implemented, such as hydraulic optimization, optimized airflow recirculation,3 and temperature and humidity controls.
- 1European Commission. Health and Consumers Directorate-General. EudraLex, Volume 4, Annex 1. “Manufacture of Sterile Medicinal Products.” 20 December 2017. https://ec.europa.eu/health/sites/health/files/files/gmp/2017_12_pc_annex1_consultation_document.pdf
- 2International Organization for Standardization. “International Standard ISO 14644-4. Cleanrooms and Associated Controlled Environments—Part 4: Design, Construction and Start-Up: F.5 Energy Conservation.” 2001. https://www.iso.org/obp/ui/#iso:std:iso:14644:-4:ed-1:v1:en
- 3Heemer, J., and H. Reynolds. “Heat Recovery Regulations and HVAC Energy Consumption.” Pharmaceutical Engineering 38, no. 3 (May–June 2018).
Human Activity’s Effect on Cleanroom Nonviable Particle Concentration
For cleanrooms, air is filtered by HEPA filters and air change rates are high to limit the number of particles. Before implementing our program, we validated the following argument:
During after-hours operations, in absence of personnel, the air change rates can be reduced because the main sources of particles are humans and human activities.
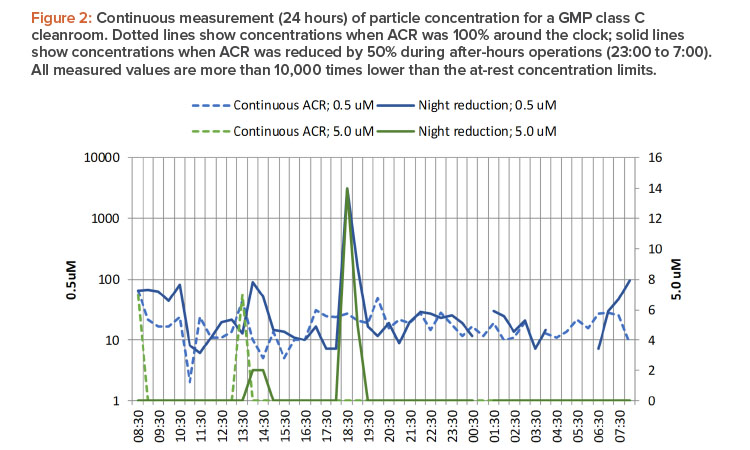
An initial step to assess this proposition was to continuously measure the particle concentration inside the cleanroom over a period of 24 hours during a typical production day and night. This demonstrates the effect of the presence of staff members.
Figure 2 depicts particle concentrations for a GMP class C cleanroom before and after implementation of 50% lower airflow during after-hours operations. After closing, from 23:00 to 7:00 (11 p.m. to 7 a.m.), the measured concentrations of particles were generally lower than during working hours. The spikes at 9:00, 14:00, and 19:00 were caused by staff members entering the cleanroom. Notably, the measured concentrations for the 24-hour period were over 10,000 times lower than the allowable limits. Similar results were found for other cleanrooms—with one exception, which is described next.
Underpressure Effect on Continuous Particle Measurement
Cleanrooms with biological safety requirements operate at underpressure (e.g., –15 Pa) to prevent the escape of air from the cleanroom. This means that air from surrounding areas flows in due to the underpressurized air. By design (bubble type4 ), adjacent areas are also cleanrooms to limit the in-flux of particles.
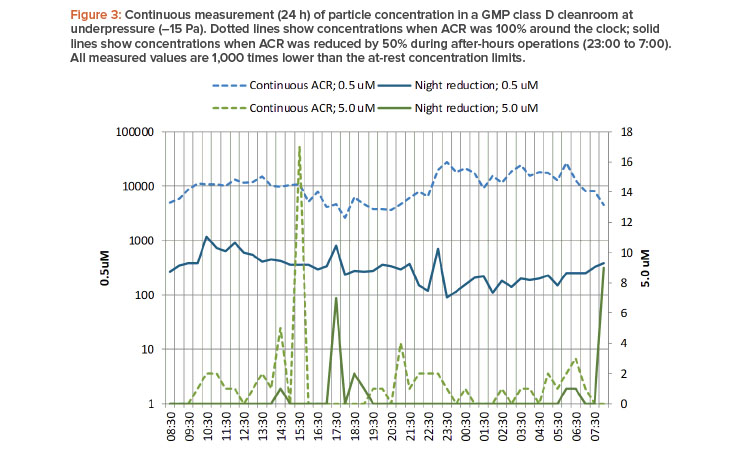
Figure 3 presents particle concentrations in a GMP class D cleanroom at underpressure. Notably, the measured concentrations were higher after hours than during working hours. This finding was unexpected and unlike measurements from the other cleanrooms.
While investigating possible reasons for the unexpected results, we found significant air leakage from the media panels and wall sockets, which are in contact with technical areas. Technical areas are not cleanrooms, and thus this leakage introduced a significant number of particles. The lower particle concentration during the day can be explained by the air mixing with more clean air from adjacent areas when doors are frequently opened. When the doors remained closed during the night, the particle concentration built up to higher levels than during the day.
During the program’s implementation period, the wall sockets and media panels were sealed off as a corrective action. Particle concentrations for both continuous and reduced airflow were measured again, and they were significantly lower than in the initial measurement. This discovery and the subsequent improvement of cleanroom air quality may be considered (what energy consultants call) a nonenergetic benefit.
Increasing After-Hours Airflow in Staff’s Presence
During risk assessments, it has been agreed that airflow in a cleanroom may only be reduced when no staff is present. Therefore, airflow must automatically increase before staff enters the clean space.
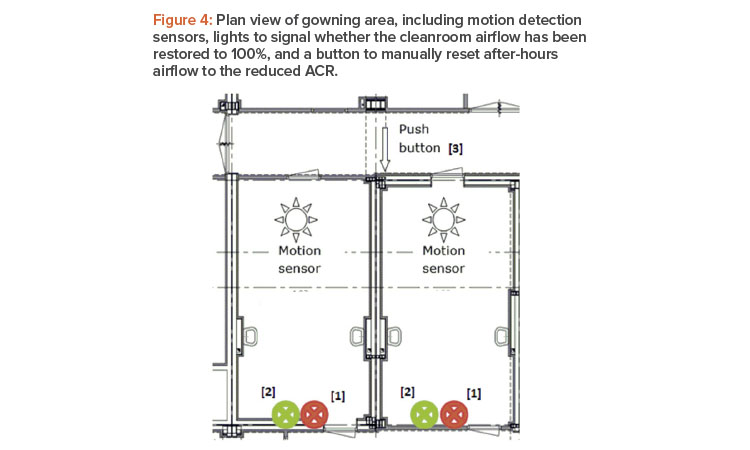
To address this issue, our program uses the following mechanisms (Figure 4): When someone enters the gowning area outside of working hours, a motion detector is triggered. This trigger signals the HVAC to return airflow to normal. Airflow via the HVAC installation is directly related to the fan power. Once the motion detection sensor is activated, HVAC fans rev up and are restored to the original flow. During the air change rate transition stage, a red indicator light flashes in the gowning area. Within 5 minutes, airflow is restored to normal; this activates the green light, indicating that staff may enter the cleanroom. Because the gowning procedure normally takes approximately 5 minutes, this waiting period does not affect staff workflow. The air change rate can be restored to reduced airflow outside of working hours by using a manual switch (indicated in Figure 4 by the push button), with the last person leaving the cleanroom responsible for the switch.
- 4Sun, W. “Cleanroom Airlock Performance and Beyond.” ASHRAE Journal 60, no. 2 (February 2018), 64–69.
Airflow and Particle Recovery Times
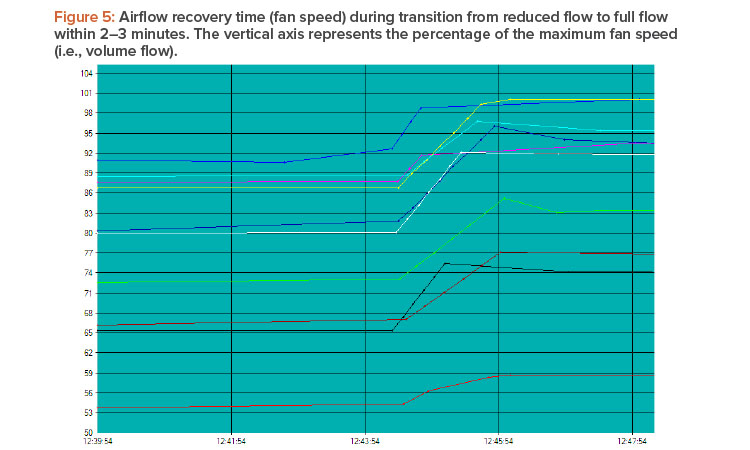
According to ISO 14644,2 the time required for airflow to recover to the original 100% flow should be demonstrated. Figure 5 depicts airflow recovery and shows that airflow is restored to the original 100% setting within 2–3 minutes.
In addition, in this case study, the particle recovery time for the cleanrooms was measured at reduced airflow. To determine the particle recovery time, particles are introduced in the cleanroom and the time it takes for the particles to be removed is measured. These measurements provide information on flow effectiveness and presence of dead zones in the cleanroom airflow. The particle recovery time at reduced flow is hardly affected and is still well within specified limits. One of the contributing factors is that the HEPA filters operate more effectively at lower airflow.
Pressure Recovery during Airflow Transitions
To prevent cross contamination between areas, pressure cascades between critical areas should be maintained during the transition from reduced to 100% airflow. During normal operation, pressure values are continuously monitored, and alarms go off when deviations occur.
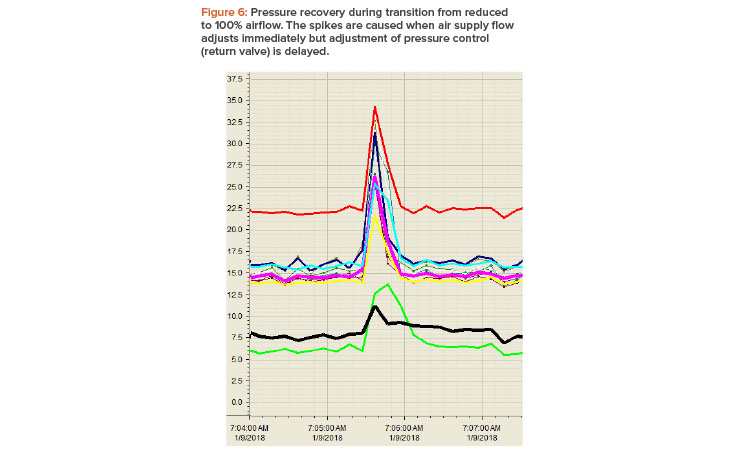
When we activated air change rate reduction, the pressure for several areas fluctuated considerably. For these specific areas, airflow was therefore increased or restored to the original 100% flow. This effect reduced the achieved energy reduction by 10%–20%. However, if the transition time is extended, the pressure fluctuation will decrease. This is one of the lessons learned from this project: to reduce the pressure fluctuation, one must smoothly adjust the set-point values and thereby gradually change the valve positions.
Figure 6 shows that pressure is the same for both reduced and full airflow (before and after the spike). During an airflow transition, the pressure spikes but the pressure cascade is maintained for adjacent areas.
Temperature Stability during Reduced Airflow
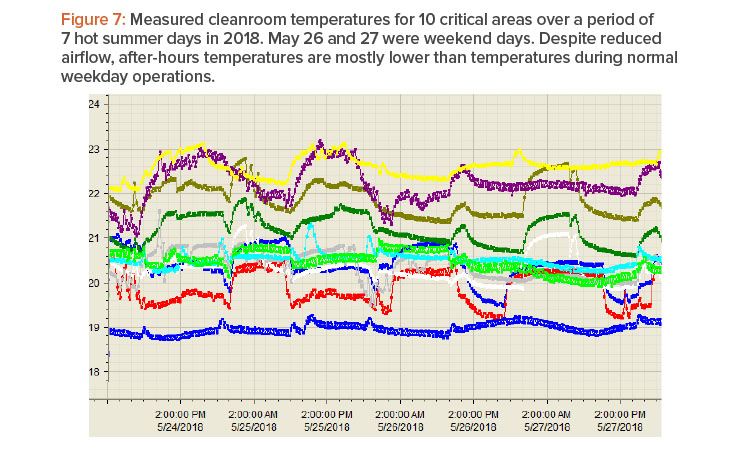
The cleanroom temperatures remain stable during operation at reduced airflow. After closing hours, the equipment load reduces substantially, and there is little to no presence of staff members. As a result, the internal thermal load and thus the required cooling load are reduced. The daily variation is shown in Figure 1 by the difference between peak and base values.
The temperature monitoring system has indicated no significant change in after-hours cleanroom temperatures. For example, over a period of 7 hot summer days in 2018, the cleanroom temperatures were generally lower during after-hours periods of reduced airflow than during operating hours when airflow was 100% (see Figure 7).
Flow Adjustment of Variable Air Volume Valves
In our building management system (BMS), air volume flow of the variable air volume valves is a setting in the software and can be adjusted to include an after-hours operation setting. The software modification should be uploaded to the system while the system is shut down; this is specifically recommended for the brand of BMS software and hardware used for our HVAC system. The upload procedure is not supposed to take longer than 1 hour. However, in our case, the upload created a significant risk because the system could not be restarted for 2 days due to a hardware/software error.
Anticipating this type of risk is another lesson learned. Implementation during shutdown is strongly advised to minimize issues associated with soft-ware modifications.
In our control software, the output signal of the BMS system to the controllers of the variable air volume unit also had to be adjusted. This meant that all output signals to the variable air volume controller and variable air volume controller limit values needed to be checked and/or adjusted individually. This was a time-consuming process, requiring several days of labor for 5,000 m2 of cleanroom area.
Fan Pressure Set-Points
The fan pressure set-point was not initially adjusted for operation at reduced airflow. Two set-points, one for daytime operation and another for nighttime, were not included in the updated control program (software). This was discovered when the HVAC fans resonated during first tests of the system. The pressure set-point of the fans had not been adjusted, but the volume flow had been reduced; this caused the fans to resonate. Resonating of the fans may lead to catastrophic failure of the HVAC system. By reducing the pressure set-point, the resonance issue was resolved.
The lesson learned was that the additional pressure set-point for the fans should be included in the software. The software adjustment planned for this year is to include an additional reduced pressure set-point for the HVAC fans after closing hours, which will significantly reduce HVAC fan electricity consumption in addition to the current energy savings.
Conclusion
Project implementation required a few days while the cleanrooms were shut down. Measurements were taken before and after shutdown and during the normal startup procedure. No increase in particles was found, and all parameters (particles, temperature, etc.) remained within their specified limits. Also, during after-hours operation, particle concentration did not increase.
Potentially, the airflow reduction could reduce HVAC energy consumption by 20%–30%. Field results show a total electricity consumption reduction of 10%. Notably, the HVACs account for about 50% of the overall energy use.
Acknowledgments
The author wishes to thank Jeroen Larrivee, Martin Elkhuizen, and Chris van Veen for their reviews of the manuscript.
